Retouch Nexus Dashboard
For the RETOUCH NEXUS case studies, the dashboard below summarizes the main characteristics of their water governance systems. Water governance in the EU presents a comprehensive framework that aims to ensure sustainable use and management of water resources. Please click the buttons to learn about water governance structures, the main challenges to sustainable water governance and data and evaluation of water policies in the case studies.
Water Governance Structure
Challenges To Sustainable
Water Management
Data And Evaluation
Of Water Policies
| Estudios de casos | Coordination Mechanisms | Water Policy Setting | Implementing Institutions | |||||
|---|---|---|---|---|---|---|---|---|
| Vertical Coordination | Horizontal Coordination | National Government | Regional Government | National Authorities | Regional Authorities | Municipalities | River Basin Managers | |
| SPAIN Jucar River Basin |  Top-down | | METDC Ministry for Ecological Transition and Demographic Change (Spain) | Valencia, Castilla-La Mancha | NWA NWA – National Water Agency (Spain) | | | |
| NETHERLANDS North Holland | Bottom-up | | MIWM MIWM – Ministry of Infrastructure and Water Management (The Netherlands) | North Holland | RWS RWS – Rijkswaterstaat (Department of Waterways and Public Works) (The Netherlands) | | | |
| SLOVAKIA South-Western Slovakia | Top-down | | ME ME – Ministry of Environment (Slovakia) |  | SWME SWME – Slovak Water Management Enterprise (Slovakia) | | | |
| BELGIUM Flanders | | | | Flanders | | CIW CIW – Flemish Committee for Integrated Water Policy (Belgium) | | |
| GERMANY Upper Main District | Top-down | | Federal Government | Bavaria: MECP MECP - Bavarian Ministry of Environment and Consumer Protection (Germany) | | SOE SOE - Bavarian State Office for the Environment (Germany) | | |
| MALTA Malta River Basin | | | MEEE MEEE – Ministry of Environment, Energy and Enterprise (Malta) | | ERA ERA – Environment and Resources Authority (Malta) | | | (basin = the whole country) |
| Estudios de casos | WEFE Nexus in Water Governance | Measures for Water Scarcity and Precaution | Capacities of institutions(personal and financial) | Other Specific Challenges |
|---|---|---|---|---|
| SPAIN Jucar River Basin | collaboration among sectors is facilitated | | declared capacities and level of autonomy are sufficient | Water markets extension public-private, Partnership for innovations |
| NETHERLANDS North Holland | Cross-sectoral cooperation at the national level, emphasis on water-soil nexus | | Institutions adequately equipped from the judicial responsibility point of view | Societal demand shifts create pressure on an increase of capacities |
| SLOVAKIA South-Western Slovakia | Basic collaboration, water-soil concept under development | | Lack of capacities, a review of competences and institutional structure is foreseen | Stable financing of state water administration required |
| BELGIUM Flanders | Basic collaboration, WEFE nexus concept not developed yet | | Lack of structural, long-term funding mechanisms for water systems management | Valuing water such that investments in alternative water sources are facilitated Resilience to climate change |
| GERMANY Upper Main District | Basic collaboration, WEFE nexus concept not developed yet | | Capacity limits (personal and financial) have been reached | Water withdrawal charges not applied in Bavaria |
| MALTA Malta River Basin | Cross-sectoral coordination between water and energy, and environment well developed | | Institutions have adequate capacities | Energy dependency for water supply of the island |
| Estudios de casos | Legislative Requirements | Data Availability | Challenges | |
|---|---|---|---|---|
| Legislative requirements for water policy monitoring and evaluation | Water Information System | Diverse Data Source | Challenges for empirical evidence on water resources and water policies | |
| SPAIN Jucar River Basin | | | | Gaps in data collection for groundwater use in regions with its quality or quantity problems gaps in economic valuation of ecosystems and ecosystem services |
| NETHERLANDS North Holland | | | | Water-related environmental information publicly available, but interpretation may be complex; progress in the implementation of the WFD programmes of measures reported online at the level of regional water authorities |
| SLOVAKIA South-Western Slovakia | | | | Incomparable structure of information in fragmented data sources, some information only for actual time period, historical time series difficult to access, some data not publicly available |
| BELGIUM Flanders | | | | Gaps in temporal resolution of water abstraction data, real time data on water quality, data on measures taken by water users, digital water metering |
| GERMANY Upper Main District | | | | Gaps in survey of public water supply – it does not provide individual characteristics such as water delivery to agriculture |
| MALTA Malta River Basin | | | | Data collected by a central authority, a water information system is under development |
- WEFE Index
- Sectoral Interactions and Trade-offs
- Water Pricing as a Driver of Species Resilience
The WEFE index results reveal consistent discrepancies across climate models, SSP scenarios, and water pricing strategies, with resource access exceeding availability in all sectors. System performance progressively improves across water pricing strategies, rising from 63 in the Baseline to 65 under Dynamic Water Pricing (DWP) and 70 under Uniform Water Pricing (UWP) for the period 1979–2050.
UWP achieves the strongest gains in environmental and resource-use dimensions, with a 38% increase in the Ecosystem Index, a 21% gain in the Energy Index, and an 8% increase in the Water Index, reflecting its effectiveness in curbing water withdrawals and enhancing ecological sustainability. DWP produces more moderate improvements, with smaller increases in the Ecosystem (+20%), Energy (+7%), and Water (+1%) indices. Both strategies involve trade-offs in the food sector, reducing the Food Index by 8% (DWP) and 6% (UWP), reflecting economic efficiency losses in lower water-productivity crops. Overall, UWP demonstrates that simplified and transparent pricing schemes provide strong incentives for efficient resource use and ecosystem protection, but its broader economic implications, particularly for food security, must be carefully considered.
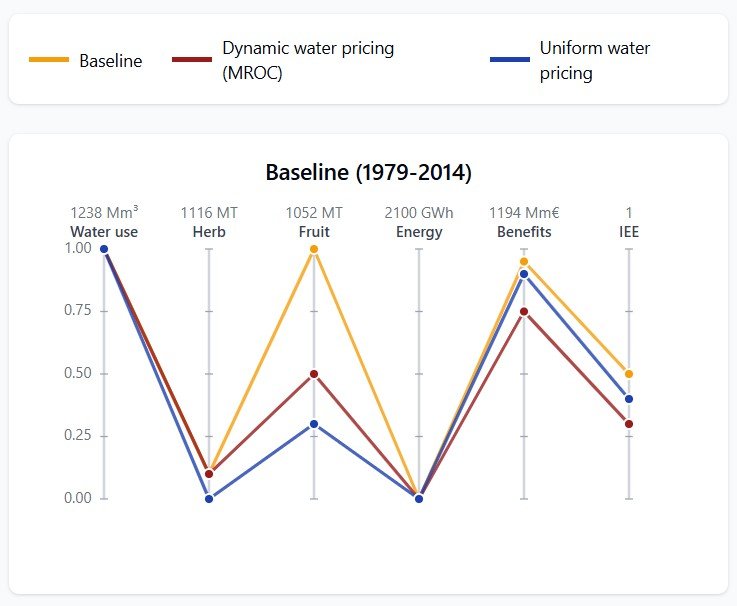
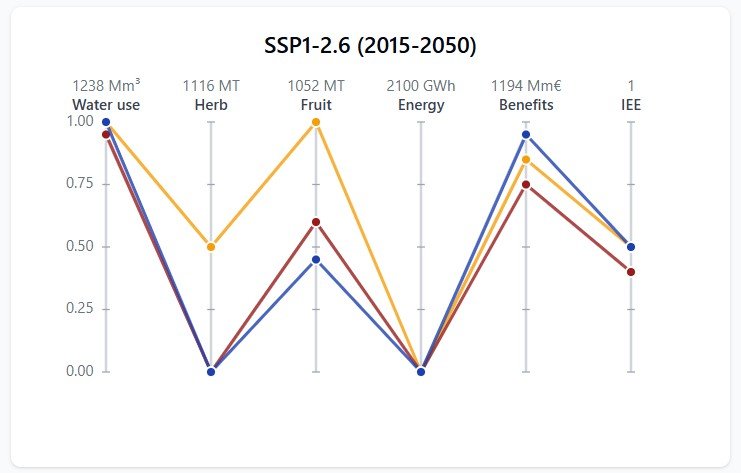
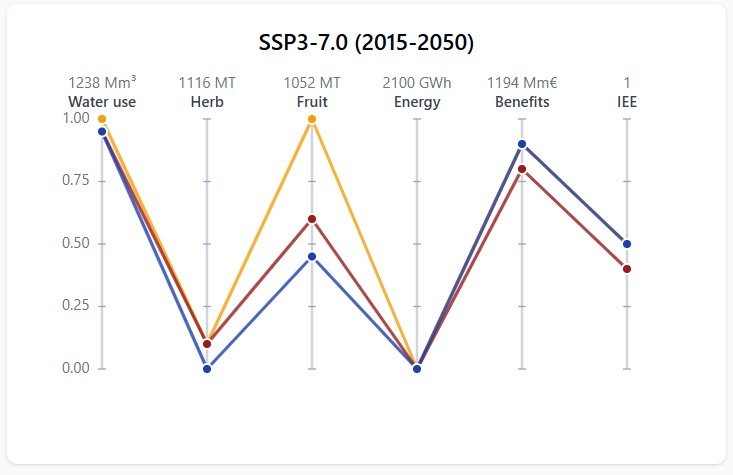
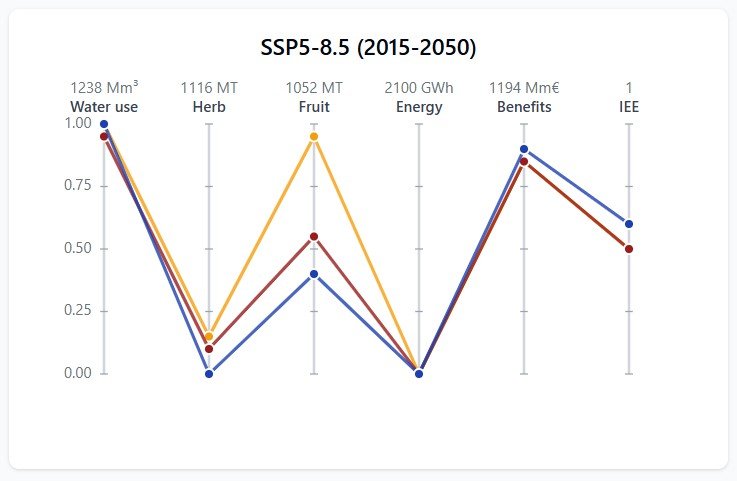
The figure illustrates the influence of water pricing strategies on cross-sectoral interactions and trade-offs within the WEFE nexus for the historical and future periods under SSP scenarios. Both strategies reduce unsustainable water use while preserving economic benefits and improving system efficiency and water scarcity indicators. UWP) substantially reduces average total water withdrawals, from 1,078 Mm³ in the Baseline to 793 Mm³ for the period 1979–2014, with reductions further amplified under future climate and socio-economic conditions, reaching 759 Mm³ under SSP5-8.5. This decrease generates energy gains and lowers system water scarcity to 0.44 for 1979–2014 and 0.56 for 2015–2050 under SSP5-8.5. However, the rigid pricing structure severely penalizes lower-productivity crops, reducing herbaceous production from 562 MT to 30 MT for 1979–2014 and potentially to 13 MT for 2015–2050 under SSP5-8.5, while moderately decreasing fruit tree and citrus production from 769 MT to 564 MT for the historical period and potentially to 499 MT under SSP5-8.5.
The DWP follows a similar trajectory to the UWP, but with a more balanced and less pronounced reduction in water withdrawals. Its flexible structure limits negative impacts on crop production, with herbaceous crops experiencing moderate reductions, from 562 MT in the baseline to 454 MT for 1979-2014 and to 406 MT for 2015-2050 under the SSP5-8.5 scenario, while fruit tree and citrus production remain largely stable under the SSP1-2.6 and show only slight reductions under SSP3-7.0 and SSP5-8.5. This approach preserves greater resource and economic efficiency while achieving moderate environmental and energy gains, providing a more balanced trade-off across the WEFE sectors compared to the more rigid UWP.
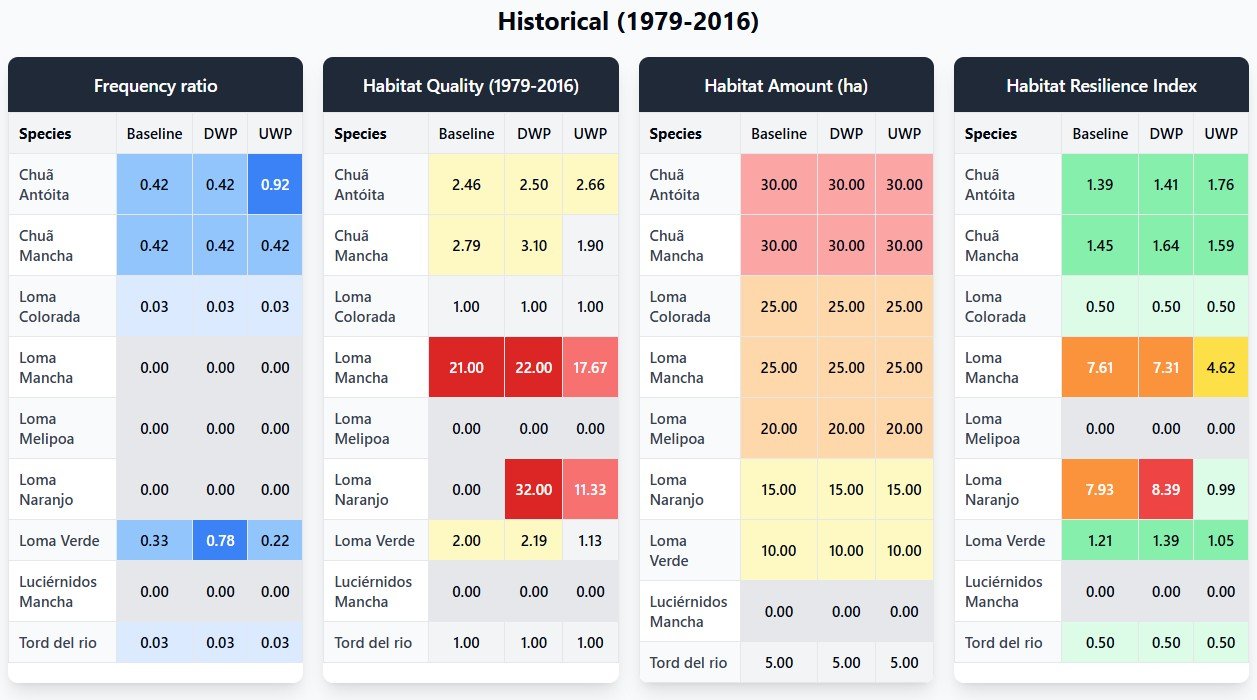
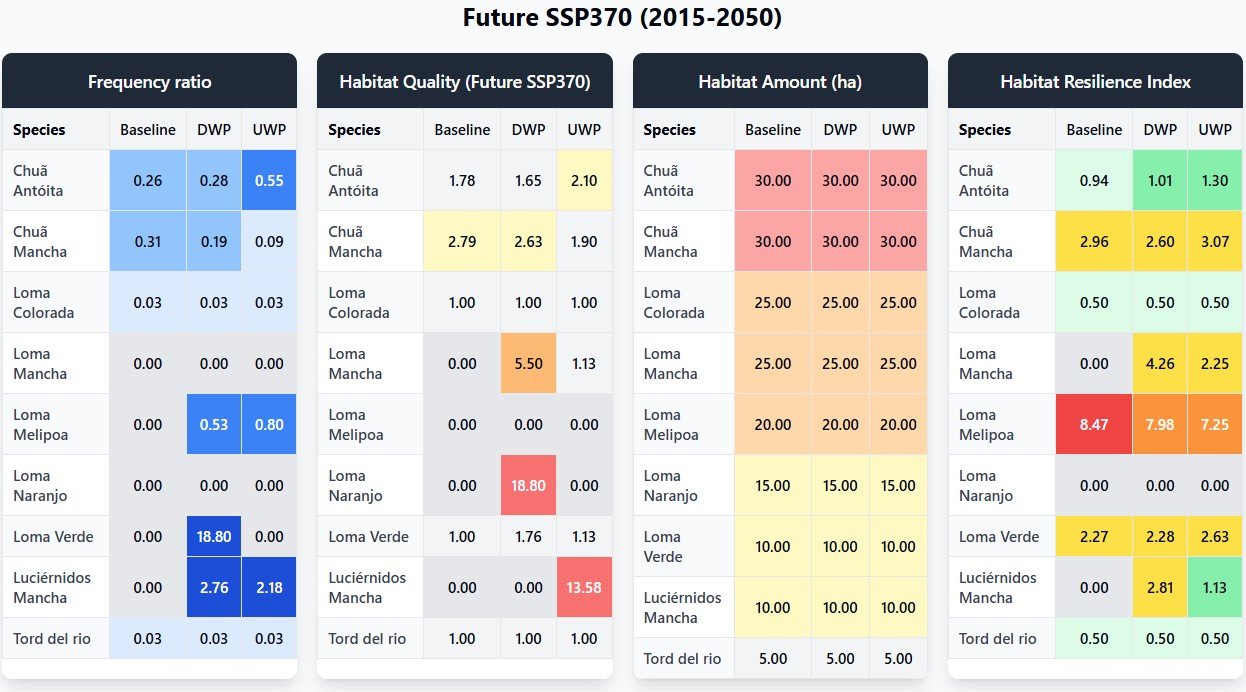
Water pricing strategies not only influence sectoral water allocation and economic outcomes but also play a critical role in enhancing the resilience of aquatic ecosystems. Results indicate that both water pricing strategies reduce the frequency ratio, the mean, and the maximum duration of habitat below the ecological threshold, as well as the severity index, thereby strengthening the resilience of most species in the river basin. The most resilient species are Chub, Loina contreras, Luciobarbus antella, and Trout, consistently maintaining a high percentage of Habitats Provisioning Units (HPU) close to 1.00 across historical and future scenarios, with marginal gains under both pricing strategies. Sensitive species, such as Loina mancha, Loina molinar, and Loina naranjo, exhibit more pronounced improvements in %HPU, with reduced severity and increased resilience under both Dynamic and Uniform Water Pricing, reflecting their high sensitivity to water allocation management. These findings demonstrate that water pricing not only alleviates the impacts of water scarcity but also strengthens ecosystem stability, providing targeted benefits for vulnerable species while sustaining the persistence of naturally resilient populations.
- Introduction
- Baseline: Slovak economy in 2021
- Scenario 1 : Changes in Food Demande Composition
- Scenario 2 : Improved Water Efficiency in Agriculture
- Scenario 3 : Water-Use Restriction in Agriculture
- Scenario 4 : Economy-Wide Water Constraint
To explore the economic and environmental implications of water use in Slovakia, a set of model scenarios was developed and implemented within the environmentally extended input-output framework. The IO model ensures that both direct and indirect effects of shocks are captured, providing a view of system-wide impacts. These scenarios developed reflect potential changes in final demand, production technologies, and water availability, allowing assessment of how sectoral water consumption as well as key economic indicators respond to different conditions. For the economic and environmental assessment, the following indicators are used:
- Output value,
- Value added,
- Employment,
- Water consumption.
Baseline
The year 2021 is used as the baseline for the analysis, representing the structure of the Slovak economy and its water consumption under current conditions. The baseline model allows for the assessment of both economic performance and water use, providing a reference point against which alternative scenarios can be compared. Economic performance is evaluated in terms of key indicators, including sectoral and economy-wide output, value added, and employment. Water use is analyzed comprehensively, considering total water consumption in the economy, sectoral water use, and the water footprint of goods produced across different sectors. This baseline provides a detailed picture of how water resources are allocated within the Slovak economy and which sectors and products exert the greatest pressure on water resources.
The baseline scenario represents the Slovak economy in 2021, capturing sectoral outputs, value added, employment, and water consumption as per main sectorial aggregates, reflecting both production and supply-chain processes.
In the structure of the Slovak economy, services and manufacturing sectors are dominant in terms of economic output and employment, while agriculture and the food industry play a relatively minor role economically but exert significant pressure on water resources (Table 1, Figure 2). Agriculture generates only 5.3 billion USD in output (around 2% of the total) but consumes 123 million m3 of water, representing almost 29% of total water use. Similarly, the food industry, with just 5.1 billion USD in output, uses 69 million m3 of water. These figures highlight a structural imbalance, where sectors with low economic contribution (particularly agriculture) are disproportionately water-intensive, underscoring the importance of targeted policies for improving water efficiency and managing demand in agriculture and food production.
| Colonne 1 | Total economy | Agriculture | Food industry | Manufacturing | Services |
|---|---|---|---|---|---|
| Output (mil USD) | 270,007 | 5,339 | 5,108 | 112,462 | 147,098 |
| Value added (mil USD) | 105,156 | 2,059 | 1,228 | 25,712 | 76,157 |
| Employment (th ppl) | 2,710 | 110 | 35 | 581 | 1,985 |
| Water consumption (mil m3) | 429 | 122 | 68 | 152 | 87 |
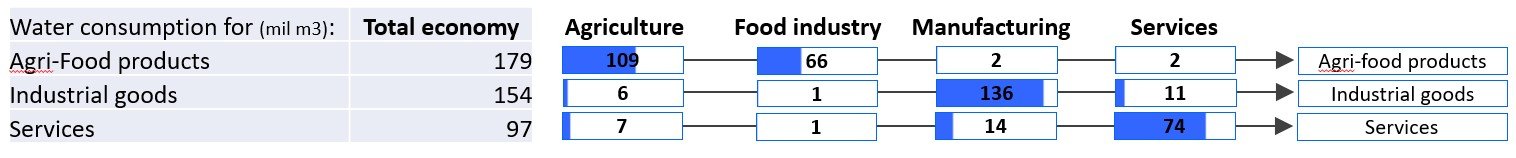
The water footprint analysis reveals distinct sectoral contributions to the production of different categories of goods and services (Figure 3). Agri-food products account for the largest share of water use at 179 million m3, and this category of goods is almost entirely associated with water used in agriculture (109 million m3) and the food industry (66 million m3). In contrast, industrial goods require 154 million m3 of water, with about 88% of the total (136 million m³) originating from the manufacturing sector, while agriculture and services contribute only marginally. Services exhibit a total water footprint of 96 million m3, most of which stems from water use within the service sector itself (76%) and a smaller share stems from the manufacturing sector (14%), reflecting operational and infrastructure-related requirements rather than extensive supply-chain inputs. The findings therefore reflect the distinct ways in which food, industrial goods, and service provision create pressure on water consumption in agriculture, manufacturing, and the service sector. Accordingly, policies aimed at improving water sustainability should be informed by the distinct pathways through which final demand generates water consumption pressures across sectors.
Changes in food demande composition (Scenario 1)
| % change rel. to baseline | Total economy | Agriculture | Food industry | Manufacturing | Services |
| Output (%) | 0.08 | 3.41 | -0.51 | 0.01 | 0.03 |
| Value added (%) | 0.11 | 4.60 | -0.43 | 0.01 | 0.02 |
| Employment (%) | 0.15 | 3.50 | -0.79 | 0.01 | 0.03 |
| Water consumption (%) | 0.99 | 4.19 | -1.37 | 0.02 | 0.04 |
Under Scenario 1, which assumes a dietary shift toward more plant-based foods (final demand for cereals, fruits, vegetables +20%, meat -5%), total water consumption in the total economy increases by 0.99% compared to the baseline. The most pronounced effect occurs in agriculture, where water use rises by 4.19%, reflecting the additional water needs associated with expanded crop production. By contrast, the food industry experiences a 1.37% decrease in water consumption due to reduced meat processing. This indicated that although plat-based foods create pressure on water resources in primary production, they are less water intensive than animal-based products in the processing stage. Changes in manufacturing and services are negligible (0.02% and 0.04%, respectively), confirming that the water impacts of this dietary shift are concentrated in agriculture and, to a lesser extent, food processing. Overall, while lower demand for meat reduces water use in processing, the increase in crop production leads to a net rise in total water consumption, as many plant-based foods, particularly fruits and vegetables, remain water-intensive in the primary production stage.
Improved Water Efficiency in Agriculture (Scenario 2)
| % change rel. to baseline | Total economy | Agriculture | Food industry | Manufacturing | Services |
| Output (%) | 0.00 | 0.00 | 0.00 | 0.00 | 0.00 |
| Value added (%) | 0.00 | 0.00 | 0.00 | 0.00 | 0.00 |
| Employment (%) | 0.00 | 0.00 | 0.00 | 0.00 | 0.00 |
| Water consumption (%) | 0.99 | -3.90 | 0.00 | 0.00 | 0.00 |
Scenario 2 reveals a 5% improvement in the water efficiency of crop production (i.e., 5% less water required per unit of output) produces exclusively environmental effects, with no changes in output, value added, or employment (Table 3).
This outcome confirms that efficiency improvements do not alter economic activity in the short term. As a result of more water-efficient crop production, agricultural water use decreases by 3.90%, which translates into a 1.11% reduction in total water consumption at the economy-wide level. Other sectors, including the food industry, manufacturing, and services, remain unaffected because the efficiency gain applies solely to crop production processes. The results indicate that technological and management improvements in crop production can meaningfully reduce water use without compromising economic performance.
Water-Use Restriction in Agriculture (Scenario 3)
| % change rel. to baseline | Total economy | Agriculture | Food industry | Manufacturing | Services |
| Output (%) | -0.39% | -4.43% | -0.78% | -0.14% | -0.43% |
| Value added (%) | -0.45% | -5.50% | -1.48% | -0.19% | -0.38% |
| Employment (%) | -0.57% | -5.83% | -0.91% | -0.12% | -0.40% |
| Water consumption (%) | -1.71% | -4.96% | -0.28% | -0.34% | -0.62% |
Scenario 3 simulates the effects of a 5% reduction in water availability for the agricultural sector, representing a situation where water acts as a limiting factor for economic activity (Table 4; in the results table, water consumption for the aggregate “Agriculture” decreases by 4.96% rather than 5% because this aggregate also includes forestry and fishing, where no restriction was applied). As water is considered a factor determining production, restricted water availability for agriculture reduces its output and propagates both upstream and downstream through the economy, affecting sectors linked by supply chains. As a result, agriculture itself experiences a decline in the economic output of 4.43% and the total economic output of all sectors decreases by 0.39%. Corresponding reductions are observed in value added and employment.
The food industry is moderately affected due to a downstream effect: reduced agricultural production limits the availability of raw inputs for processing, while the economic impacts on manufacturing and services are smaller but measurable. Total water use in the economy falls by 1.71% reflecting not only lower water use in agriculture but also the interlinked effects which lead to reductions in water consumption of the food industry, manufacturing, and services. Overall, this scenario highlights how limitations in agricultural water availability can have ripple effects across multiple sectors, with the largest impacts, unsurprisingly, concentrated in agriculture itself.
Economy-wide water constraint (Scenario 4)
| % change rel. to baseline | Total economy | Agriculture | Food industry | Manufacturing | Services |
| Output (%) | -0.02% | -0.07% | -0.62% | 0.00% | 0.00% |
| Value added (%) | -0.02% | -0.09% | -1.28% | 0.00% | 0.00% |
| Employment (%) | -0.04% | -0.09% | -1.03% | 0.00% | -0.03% |
| Water consumption (%) | -5.00% | -0.08% | -30.24% | -0.04% | -0.65% |
Under Scenario 4, total water availability in the economy is reduced by 5%, representing an economy-wide water rationing scenario. Competition for water among sectors is a general challenge, and because sectors differ in water intensity, reductions in output are not uniform: high-water-intensity sectors shrink more, while low-water-intensity sectors shrink less. In other words, the reduction in output is, in line with economic principles, distributed proportionally to water intensity across sectors. This scenario highlights how the economic structure might shift toward less water-intensive activities and reveals potential trade-offs between water conservation and overall economic performance.
The impact of the restriction is highly uneven across sectors. The food industry experiences a dramatic decline in water use (-30.24%), reflecting its strong reliance on water-intensive operations and highlighting the vulnerability of processing activities to water scarcity. In contrast, agriculture sees only a minor reduction in water consumption (-0.08%), as its water use is largely constrained by efficiency and pre-existing allocations. The substantial reduction required in the food industry signals potential risks for food supply chains and economic stability if water restrictions are applied uniformly across the economy without accompanying efficiency improvements.
- 1. Introduction
- 2. Description of model and scenarios
- 3. Data used
- 4. Results
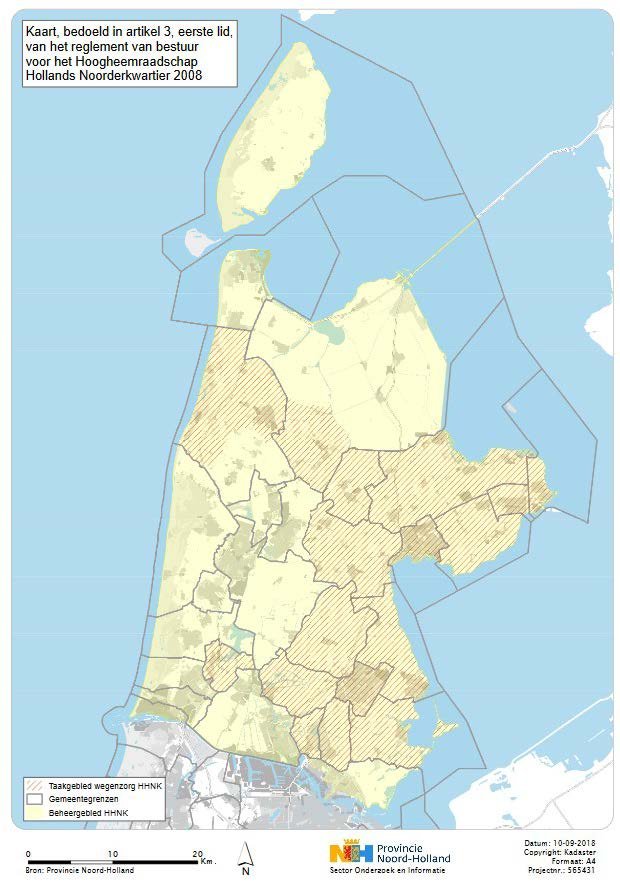
The Dutch province of Noord-Holland, largely managed by the regional water authority Hoogheemraadschap Hollands Noorderkwartier (HHNK, see Figure 1), faces increasing pressures on freshwater systems due to climate change, land subsidence and highly intensive agriculture. Episodes of prolonged summer drought, higher temperatures and more variable precipitation patterns are expected to increase the frequency and severity of water shortages and salinity problems in the coming decades. At the same time, the physical options to increase water supply are limited in this low-lying, polder-dominated landscape, where much of the area is below sea level and strongly dependent on surface water management, pumping and the control of saline intrusion.
Within the RETOUCH NEXUS project, the HHNK case study investigates how economic instruments and governance arrangements can support a more resilient management of water for agriculture, while taking into account linkages with energy use, food production and ecosystem health (WEFE nexus). The Dutch case focuses on a stated preference approach using a choice experiment (CE) among farmers. The CE elicits willingness to pay (WTP) for water-retention and drought-adaptation measures, as well as farmers’ preferences over different contractual and institutional designs.
This document presents the modelling approach and preliminary insights for the HHNK case study. It is structured as follows. Section 2 describes the conceptual model, the choice experiment framework and relevant climate and adaptation context for Noord-Holland. Section 3 summarizes the data used. Section 4 reports preliminary results based on the emerging dashboard. Section 5 highlights key insights and implications for HHNK and other regional water managers.
This section sets out the analytical framework and scenario context for the HHNK case study. We first describe the random utility/discrete choice model that underpins the choice experiment and explains how farmers’ preferences for different drought-management and water-storage options are represented. We then outline the relevant climate change and drought conditions in the HHNK service area, discuss why many farmers have not yet substantially adapted, and present the main policy instruments and behavioural responses explored in the choice scenarios. Finally, we position the case study within a WEFE (Water–Energy–Food–Ecosystems) perspective, highlighting the broader system trade-offs that motivate the design and interpretation of the model.
2.1.Conceptual model
The HHNK case study uses a choice experiment because the main objective is to understand how farmers trade off different elements of drought-management and water-storage policy packages, rather than to value a single, isolated change. So far, many farmers have been reluctant to invest in adaptation and tend to rely on the water authority to ensure sufficient supply, even though recent years and climate projections point to more frequent and severe water scarcity. By varying attributes such as abstraction bans, support for own storage, cooperation arrangements and annual costs across alternatives, the CE allows us to recover marginal utilities and willingness to pay for each component of a policy package, and to see under which conditions farmers would be willing to take more responsibility for adaptation. The CE is embedded in a broader survey that documents farmers’ experiences with drought and salinity, their current practices and their attitudes towards risk and cooperation, so that valuation results can be interpreted in context and linked to farmer heterogeneity. This combined CE–survey design also gives farmers a structured opportunity to express their preferences and concerns about future drought-management options, going beyond what can be inferred from existing market behaviour or purely technical assessments.
The HHNK case study applies a discrete choice modelling framework, interpreted as a Random Utility Model (RUM), to analyse farmers’ preferences for investments in on-farm water storage and related drought-management measures. In the survey, farmers are repeatedly asked to choose between three options: two hypothetical policy/investment alternatives (A and B) and a status quo option in which the current situation on their farm remains unchanged. The hypothetical alternatives describe possible future situations along a fixed set of attributes, while the status quo reflects the respondent’s existing practices and lack of new storage investment.
Formally, the utility that farmer i derives from alternative j in choice task t is written as U_ijt = V_ijt + ε_ijt, where V_ijt is the systematic (observable) component of utility and ε_ijt is an unobserved random term. The systematic component is specified as a function of the attribute levels of the alternatives and, in extended models, of interactions between these attributes and farmer characteristics. Farmers are assumed to choose, in each task, the alternative with the highest utility. Under standard assumptions on the distribution of ε_ijt, this yields a logit-type choice probability model.
In our baseline specification, the systematic utility is linear in the attributes: V_ijt = β_1 Ban_jt + β_2 Bridge_jt + β_3 Coop_jt + β_4 Cost_jt + … , where the main policy attributes are:
- Abstraction ban (Ban) : number of weeks per year that irrigation with surface water is not allowed (1, 3 or 6 weeks/year).
- Bridging with own storage (Bridge) : duration for which the farmer can continue irrigation using on-farm storage if abstraction from surface water is not possible (1 or 3 weeks/year).
- Cooperation (Coop) : Cooperation mode in water storage:
1. no cooperation (only own investment),
2. cooperation with HHNK (joint investment with other farmers, implemented by HHNK),
3. cooperation without HHNK (joint investment with other farmers).
Cost (Cost) : net cost per hectare per year for water storage, including investment and maintenance (1500, 2000 or 2500 EUR/ha/year).
Given a negative cost coefficient β_4, marginal utilities for the non-monetary attributes can be converted into implicit willingness-to-pay (WTP) measures by taking the ratio of attribute coefficients to the cost coefficient. This yields, for example, the WTP for extending bridging capacity from one to three weeks, or for moving from individual to cooperative investment modes.
The panel structure of the data (multiple choices per farmer) allows us to capture preference heterogeneity by letting coefficients vary across individuals, either through interaction terms (e.g. with farm size, past drought or salinity experience, or attitudes such as risk perception and trust in HHNK) or through random-coefficients specifications. In all cases, the interpretation remains demand-side: we model how farmers trade off costs, restrictions and cooperation arrangements when considering investments in water storage.
This stated preference RUM framework is complementary to physically based models. It does not simulate the hydrological system directly, but provides quantitative evidence on the behavioural and economic responses that underpin adoption of drought-adaptation measures in a setting where conventional supply-side expansion is severely constrained.
2.2. Climate change and drought in the HHNK service area
Climate projections for the Netherlands indicate warmer and drier summers, more frequent and intense drought events, and increasing pressure from salinity, particularly in low-lying coastal regions such as Noord-Holland. These changes are expected to result in:
• more frequent periods of low surface water levels and reduced possibilities for freshwater intake from main water bodies;
• increased risk of salt intrusion into surface waters and potentially into shallow groundwater, affecting both crop yields and the usability of water for irrigation;
• higher reliance on existing pumping infrastructure and storage capacity to maintain target water levels in polder systems.
In the HHNK service area, the combination of low-lying land, high drainage intensity and limited space for large-scale new reservoirs means that conventional supply-augmentation options are limited or costly. Historically, farmers have relied on the water authority to secure sufficient supply and have been reluctant to invest in on-farm adaptation, even as recent summers and climate projections point to more frequent and severe water scarcity.
Adaptation in this context requires a portfolio of measures that reduce demand during peak stress periods, increase local buffering and storage where feasible, and improve the timing and coordination of abstractions at both farm and network level. Against this background, the choice experiment introduced above represents stylised future policy and investment options for drought management and water retention in agriculture. Rather than modelling detailed climate scenarios, the HHNK case focuses on how farmers respond to different combinations of restrictions, support for storage and cooperation arrangements under a climate regime in which drought risks are expected to intensify.
2.3. Why farmers may not yet be adapting
Despite increasing awareness of climate risks, many farmers in Noord-Holland have not yet implemented substantial on-farm adaptation measures beyond incremental adjustments. Several strands of theory help explain this adaptation gap:
• Risk and ambiguity aversion: Investments in storage or other adaptation measures require upfront costs for benefits that are uncertain in timing and magnitude. Under ambiguity and learning about climate risks, farmers may postpone investment even when it is economically rational in expectation.
• Credit and liquidity constraints: Especially in sectors with thin margins, farmers may lack access to affordable finance or sufficient liquidity to undertake lumpy investments in storage infrastructure or new irrigation technology.
• Behavioural barriers and status quo bias: Farmers may underestimate future drought risk or over-weight recent wet years, leading to underinvestment in long-lived adaptation. Established routines and limited time can reinforce inertia.
• Collective action and coordination problems: Some measures (for example shared storage, coordinated abstraction, or collective management) require cooperation among farmers or between farmers and HHNK. Without clear rules, monitoring and enforcement, free-riding and strategic uncertainty can stall investment.
• Perceived policy uncertainty: If farmers are unsure about future policy on abstraction bans, compensation rules or cost-sharing arrangements, they may wait until the policy environment becomes clearer before committing to irreversible investments.
The choice experiment is explicitly designed to shed light on these mechanisms by varying, in a controlled way, the presence of cooperation arrangements, the probability and severity of droughts, and the costs of , and by linking choices to farmer characteristics, experiences and perceptions.
The choice experiment scenarios explore different combinations of instruments that could induce farmers to invest in adaptation and water retention, and to move away from a passive reliance on the water authority towards more proactive on-farm measures. In particular, the CE directly varies three elements:
• Support for own storage: Changes in the duration of bridging with own storage represent different levels of effective support for maintaining irrigation during droughts, which can reduce perceived risks of investing in on-farm storage.
• Conditional abstraction rules: Temporary abstraction bans or restrictions, combined with different levels of bridging capacity, shift incentives towards investment while safeguarding minimum water levels and preventing over-abstraction during peak stress.
• Cooperation and collective schemes: Cooperative arrangements – for example through investments implemented together with HHNK or with other farmers – may exploit economies of scale in storage, reduce local conflicts and lower transaction costs of adaptation.
In the broader policy context, information and advisory services also play a role: providing targeted information on climate risks, technical options and contractual terms can reduce uncertainty, address misconceptions and lower non-monetary costs of participation, even though this aspect is not explicitly represented as a separate attribute in the CE.
The estimated WTP measures derived from the RUM provide quantitative guidance on how attractive different combinations of these elements are to farmers, and how strongly they respond to cost signals, restrictions and cooperation opportunities. This allows us to identify policy packages that are not only technically promising, but also behaviourally and economically acceptable to the farming community.
2.4. WEFE perspective for HHNK
The design and interpretation of the choice experiment explicitly consider WEFE trade-offs:
- Water : Measures that expand local storage and improve coordination can reduce peak abstractions and contribute to more stable water levels, thereby supporting overall water security in the polder system and reducing pressure during dry spells.
- Energy : Additional storage and pumping entail energy use for filling and managing basins, but may also reduce the need for emergency pumping and high-frequency interventions by HHNK. In addition, there is scope to time pumping and storage operations to periods when electricity is relatively cheap or low-carbon, and to coordinate with existing on-farm energy systems, which strengthens the water–energy link.
- Food : Improved drought resilience can stabilise yields and reduce crop losses in dry years, thereby supporting farm income stability and the continuity of local agricultural production. The primary motivation here is not national food security in a strict sense, but the economic viability of farms and associated supply chains in the region, which may indirectly contribute to a robust food system.
- Ecosystems : Reducing low-flow events and avoiding extreme water level fluctuations can benefit aquatic and wetland ecosystems, reduce salinity stress and improve water quality, particularly in environmentally sensitive peat meadow (veenweide) areas. In these landscapes, water level management interacts with soil subsidence, greenhouse gas emissions, biodiversity (e.g. meadow birds) and recreational and landscape values. Abstraction patterns and drought-management policies therefore affect a broader bundle of ecosystem services than crop production alone.
The choice experiment thus provides evidence on the acceptability and perceived attractiveness of WEFE-relevant measures from the farmer perspective. These preference-based results can later be linked to governance or hydrological assessments from other work packages to evaluate WEFE outcomes at the system level.
The empirical analysis is based on a dedicated survey and choice experiment among farmers in the HHNK service area in Noord-Holland. The questionnaire was developed jointly by HHNK and the Vrije Universiteit Amsterdam within the RETOUCH NEXUS project and focuses on how farmers currently cope with drought and water scarcity, what they expect for the future, and how they value different options for on-farm water storage. The survey instrument consists of four main components:
1. Background questions on the farm : Respondents provide information on basic farm characteristics, such as farm type, land use, size, irrigation practices and the presence (if any) of existing storage or drought measures. These questions establish the context for interpreting the choice tasks and allow for segmentation by farm type or region.
2. Experiences, expectations and measures related to drought : This block documents how farmers have experienced recent dry years and salinity problems, the degree of hindrance from water shortages, measures already taken to deal with drought, and expectations about how drought and water availability will develop in the future. It also asks what farmers consider feasible to do themselves and what they expect from HHNK and other actors. These variables help explain heterogeneity in preferences and put willingness-to-pay (WTP) estimates in the context of actual exposure, perceived risk and existing adaptation behaviour.
3. Choice experiment module : Each respondent answers a sequence of choice tasks, each presenting two hypothetical policy/investment alternatives (A and B) and a status quo option in which the current situation on the farm remains unchanged. The alternatives differ along the attributes described in Section 2: the number of weeks per year with an abstraction ban, the duration of bridging with own storage, the form of cooperation (none, with HHNK, or with other farmers), and an annual cost per hectare. The design uses blocking and randomisation to distribute choice sets across respondents and to ensure sufficient variation and statistical efficiency of parameter estimates.
4. Closing questions and socio-demographics : In the final part of the questionnaire, respondents are asked how they interpreted the choice tasks, how realistic they found the scenarios and whether they experienced any difficulties when answering. This is followed by socio-demographic questions (e.g. age, education) and additional attitudinal items on risk, cooperation and trust in the water authority. These responses allow for robustness checks on the validity of the CE answers and for linking preferences to broader attitudes and personal characteristics.
The survey uses a mix of closed questions with fixed answer categories, open questions for qualitative comments and explanations, and the choice questions that form the core of the CE. This design provides both quantitative data for econometric analysis and qualitative information to interpret and contextualise the modelling results. Survey responses are cleaned and pre-processed to construct:
- a respondent-level dataset with farm characteristics, drought experiences, expectations, attitudes and socio-demographics;
- a long-format CE dataset, containing attribute levels, the chosen alternative and respondent-specific covariates to estimate willingness-to-pay levels.
At the time of writing, data collection is still ongoing. The results presented in this document and in the accompanying dashboard are therefore based on an interim sample and should be considered preliminary and illustrative only.
In this section we highlight three key sets of results from the HHNK survey and choice experiment that will be showcased in an online interactive dashboard. First, we present descriptive statistics on farmers’ experiences with drought, their current adaptation measures and their attitudes towards cooperation. Second, we show how often farmers choose policy alternatives, that involve investment in water storage, rather than the status quo, and how this behaviour varies across farmer groups defined by survey responses. Third, we report willingness-to-pay (WTP) estimates for the main policy attributes, such as support for own storage, cooperation arrangements and abstraction bans. Together, these three components provide a concise but comprehensive picture of how farmers in the HHNK area perceive drought risks and respond to different drought-management and water-storage options.
4.1.Descriptive insights from the survey
A first set of outputs consists of pie charts (and related summary tables) that describe key survey outcomes, see Figure 2. These plots show, for example, how many farmers report having experienced (serious) hindrance from drought in recent years, which drought measures they already apply on their farm, how much storage capacity they currently have available (if any), and how they perceive future drought risks. Other descriptive figures summarise attitudes towards cooperation with HHNK and with neighbouring farmers, perceived responsibilities for drought management, and views on the feasibility of investing in additional storage.
These descriptive results provide a factual baseline for the case study: they document how farmers currently perceive and experience drought, which adaptation measures are already in place, and how open they are to different forms of cooperation and support. They also help to interpret the choice experiment results by showing how representative the sample is and where there may be important heterogeneity in exposure, constraints and attitudes.
4.2.Choice patterns and links with survey outcomes
A second set of dashboard outputs focuses on the choices made in the choice experiment. Bar charts display, for each respondent and for selected subgroups, the share of choice tasks in which one of the alternatives that involve investment in water storage (A or B) is chosen instead of the status quo option. An example is provided in Figure 3. This provides a simple yet informative indicator of how willing respondents are, on average and by subgroup, to move away from the current situation towards some form of investment in water storage and associated drought-management arrangements.
These bar charts can be conditioned on survey variables to explore how choice behaviour varies with drought experience, perceived hindrance, existing storage, farm type or attitudes towards cooperation. For example, the dashboard can contrast the share of A/B choices between farmers who report serious drought impacts and those who do not, or between farmers who already have storage and those who do not. Such comparisons help to visualise how underlying experiences and constraints shape the propensity to invest in adaptation and to accept associated restrictions or cooperative arrangements.
By combining descriptive survey outcomes with these choice-based indicators, the dashboard gives a first, largely model-free, picture of how different farmer groups respond to the proposed policy and investment options.
- Global view
- 1. Introduction
- Water balance and cost benefits analysis
- 2. Sub-case 1 : Keiberg Vossem (greenfield BP) - part 1
- 2. Sub-case 1 : Keiberg Vossem (greenfield BP) - part 2
| Scenario | Costs (PV) | Benefits (PV) | Net balance | Result |
|---|
| Actor | Category | Type | Annual value | Present value |
|---|
| Effect | BASE | BAU | INNO – Generic | INNO – As Built |
|---|
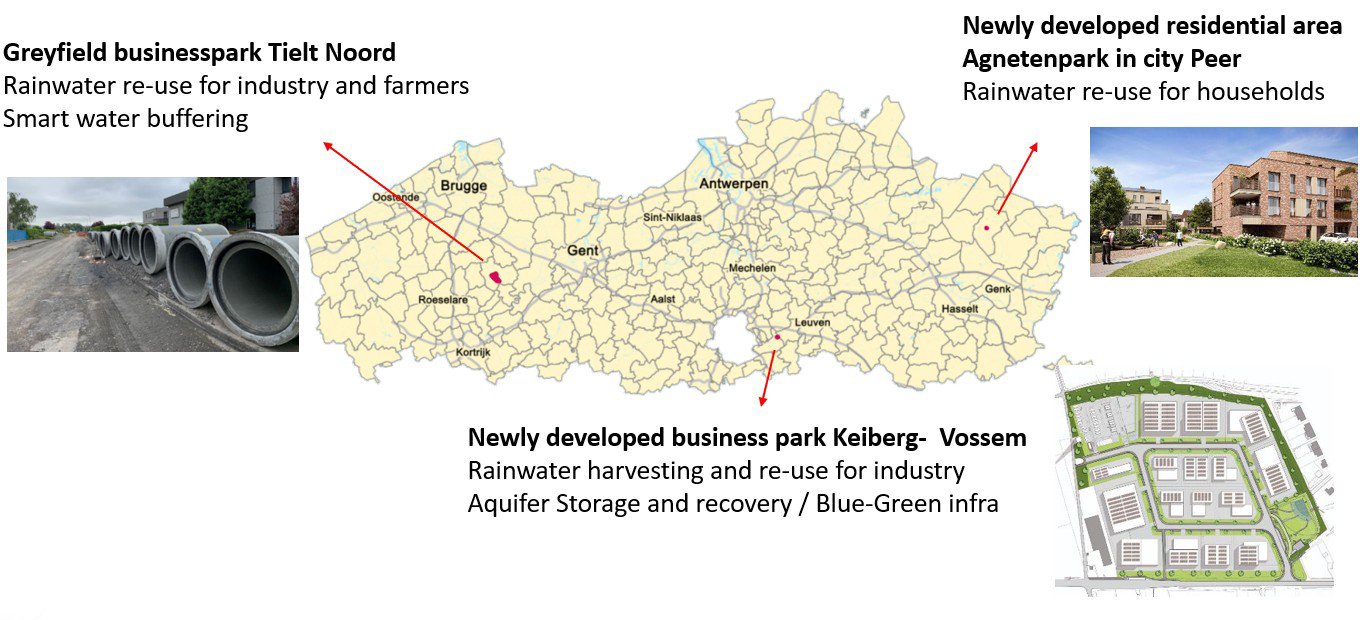
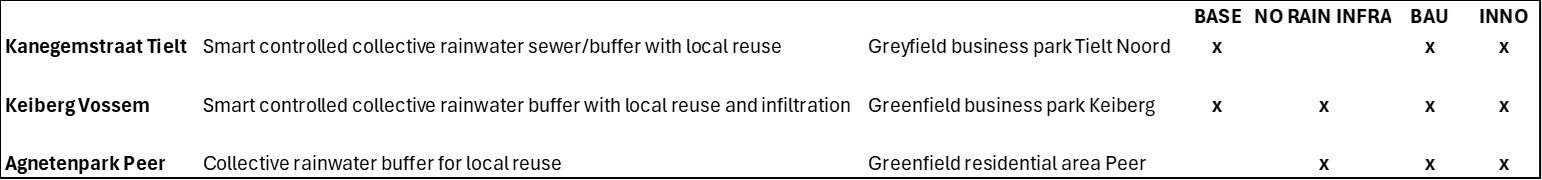
Belgian case : three local small-scale subcases with decentralized (rain)water management
Water balance and cost benefits analysis
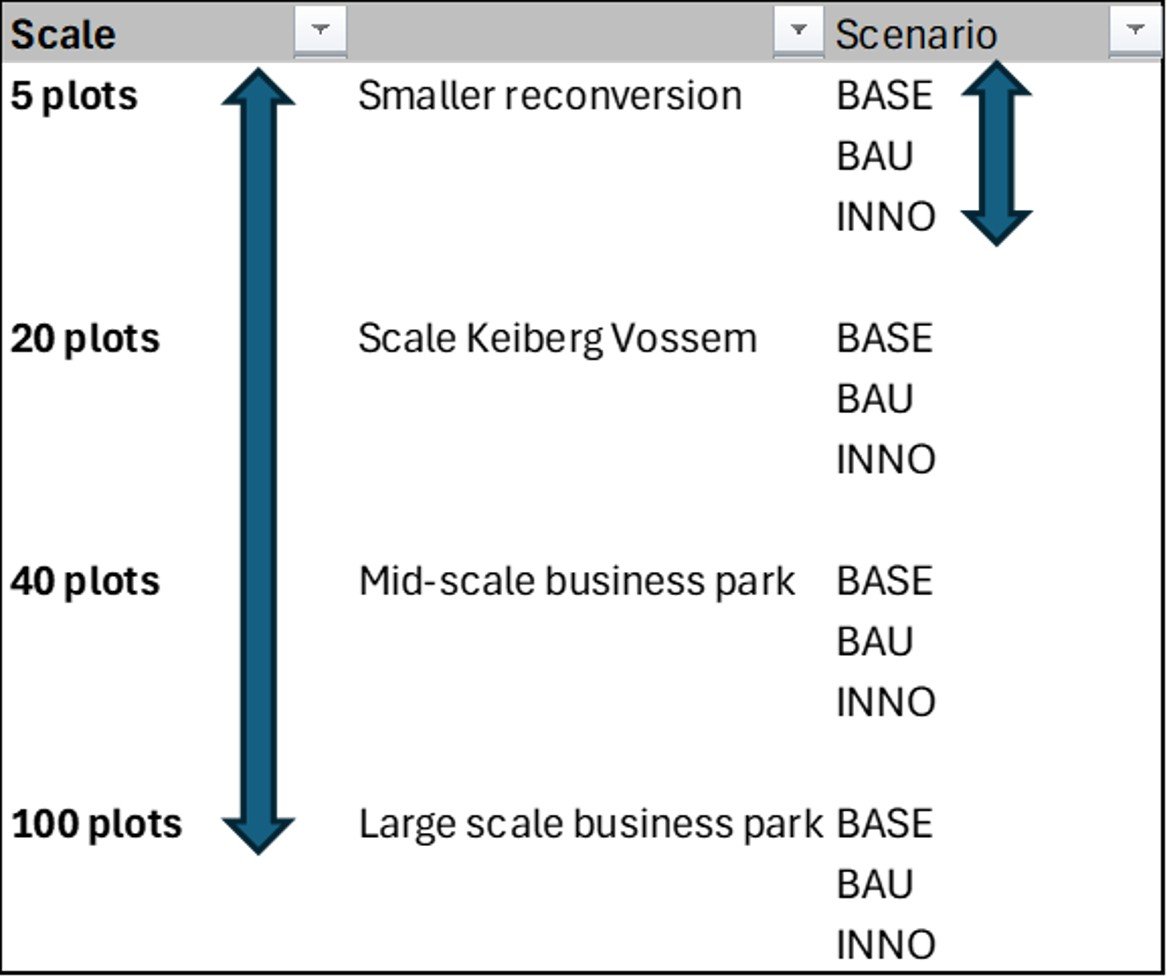
Analysis of selected cases and scenarios vs. Analysis of more generic cases
Benefits of a more generic approach -->
- Easier to apply to other locations and conditions (averaged plot sizes, re-use volumes, soil infiltration rates,…)
- Scalability
- More comparison options between scenario’s and scales
Example greenfield business parks
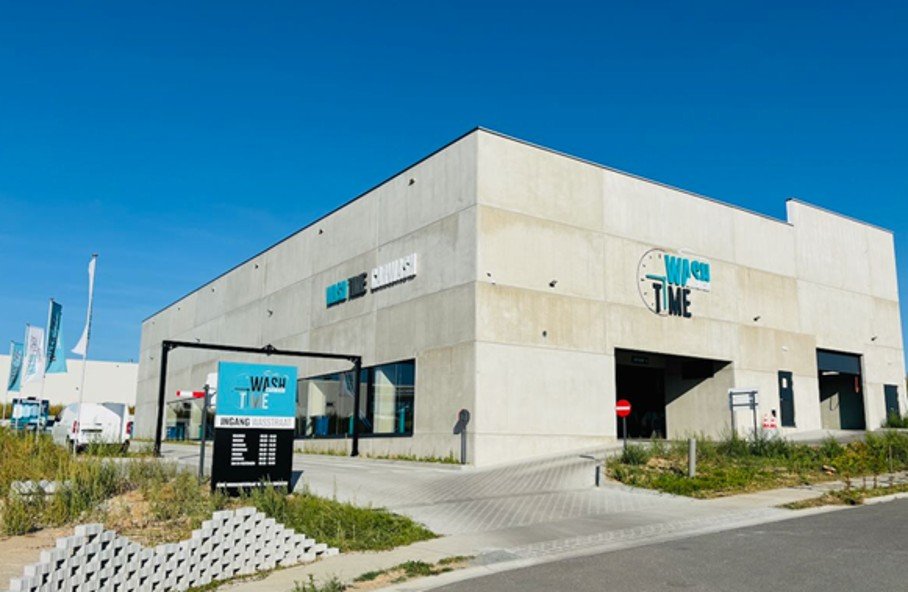
Carwash with large water consumption
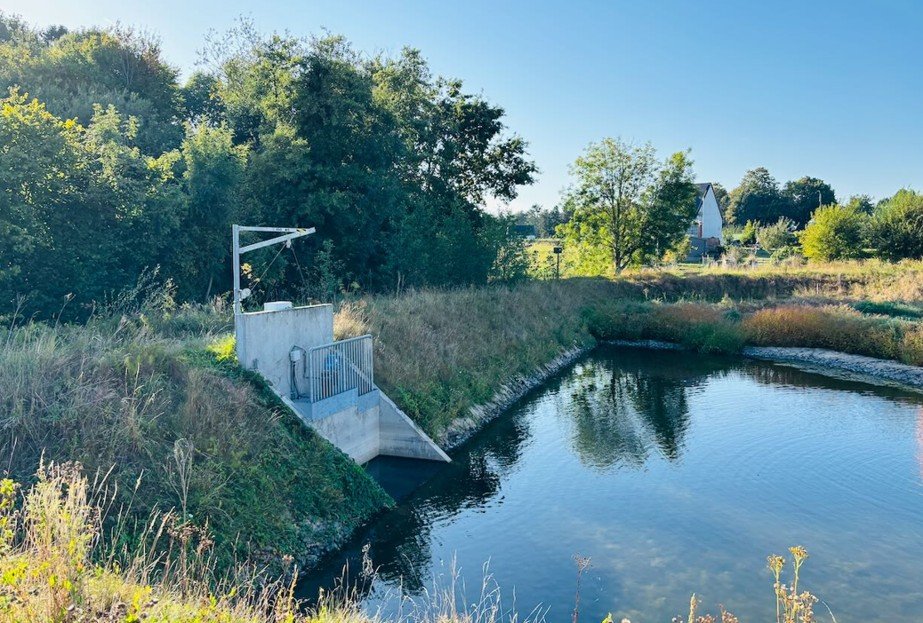
Collective stormwater buffer
General info:
- ~20 plots (still uncertain which companies will establish themselves, but already carwash, police station and expected container park)
- 8ha in total, 4,5ha roofs and pavement
- Type III extraction area for tap water
- Clay soil
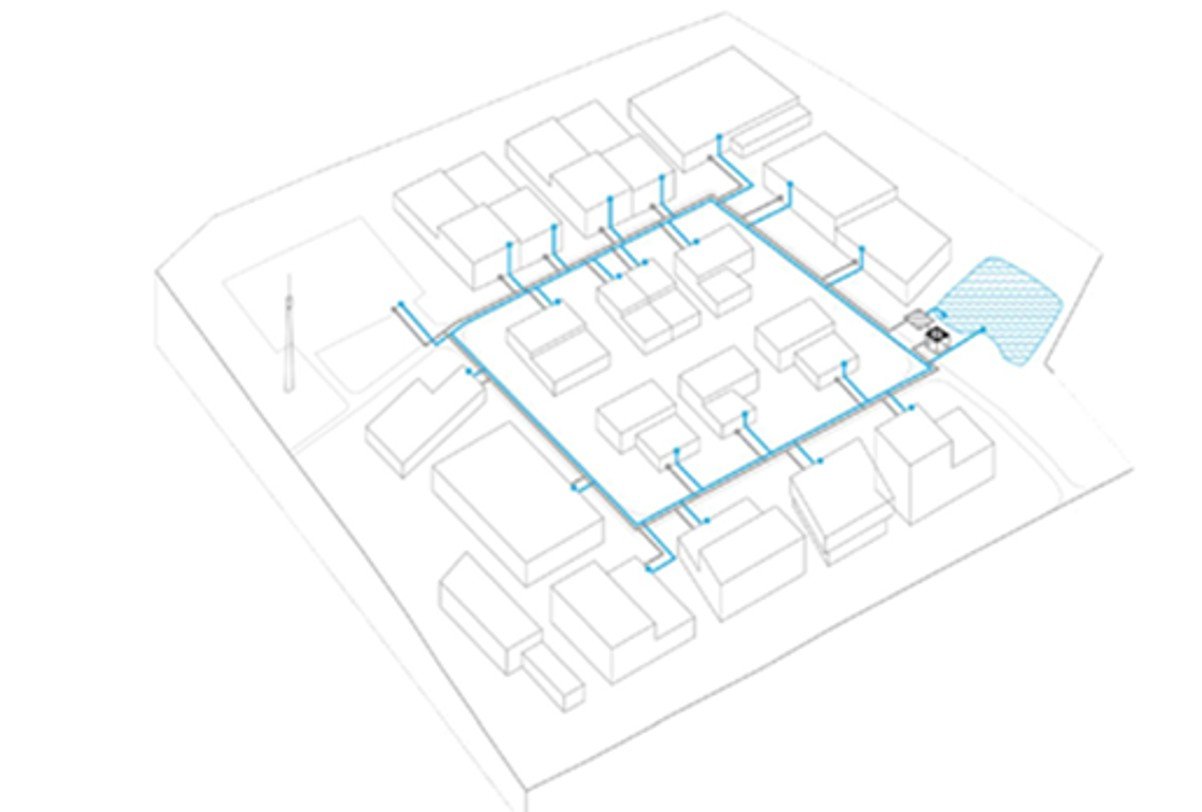
Collective decentralized waternetwork of Keiberg Vossem
Scenario’s:
- BASE: Open area - Fields
- NO RAIN INFRA: greenfield business park (4.5 ha sealed of 8 ha total) with direct rainwater run-off
- BAU: greenfield business park with individual rainwater buffers for reuse and collective buffer for peak shaving, according to Flemish legislation
- INNO: as built collective rainwater buffer with reuse system and infiltration of excess water
Some modelling water balance results
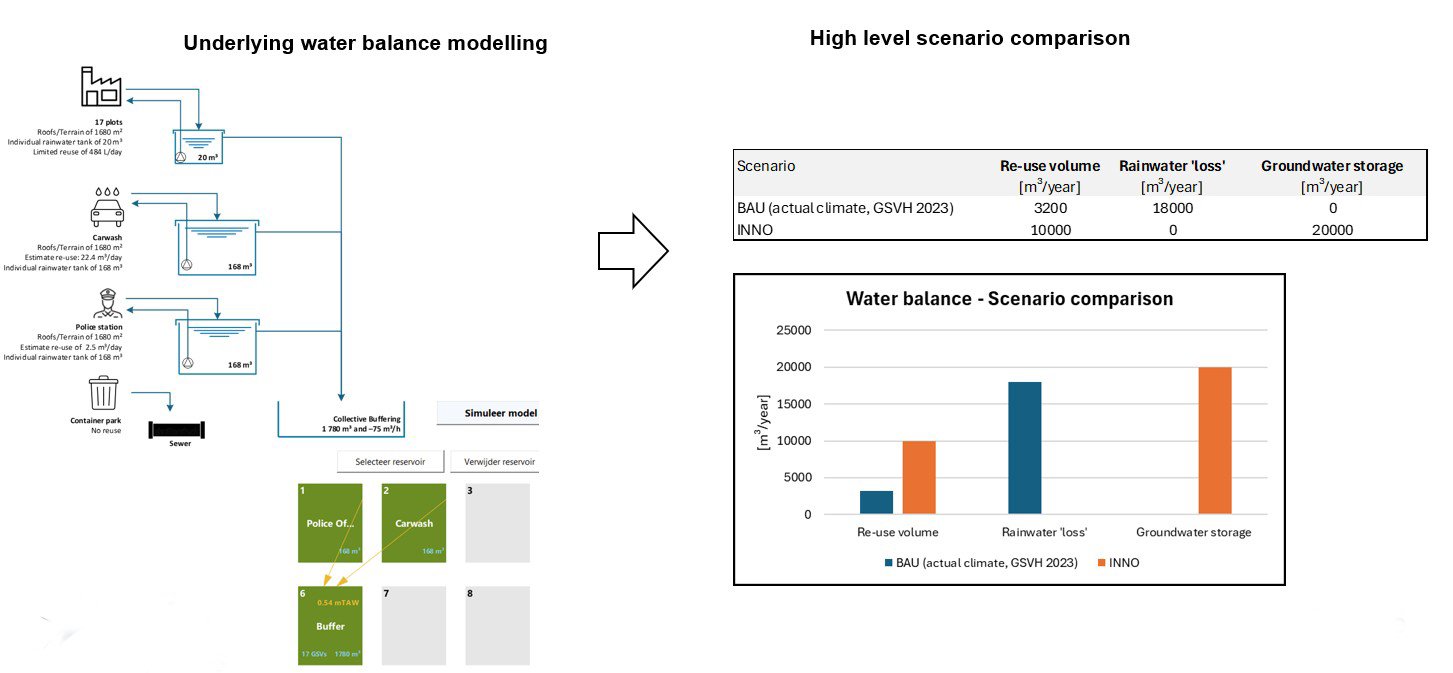
Modelling water balance results : KPI's dor further CBA
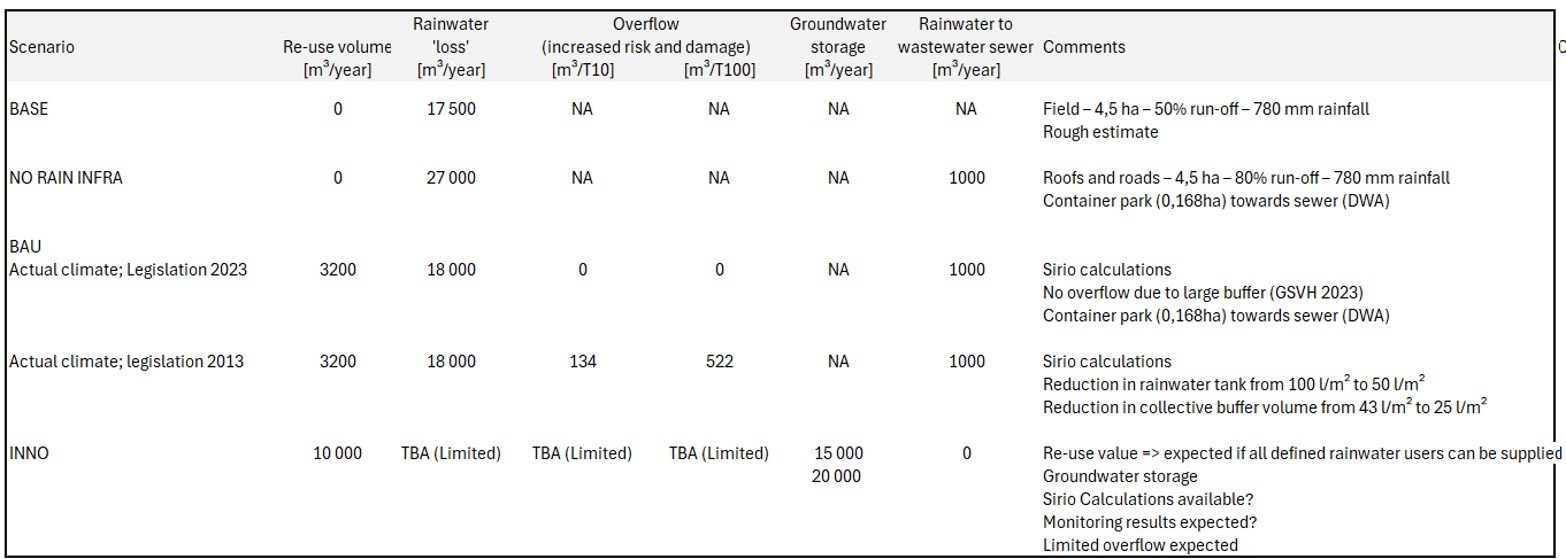
KPI’s for further CBA
Cost Benefits analysis results
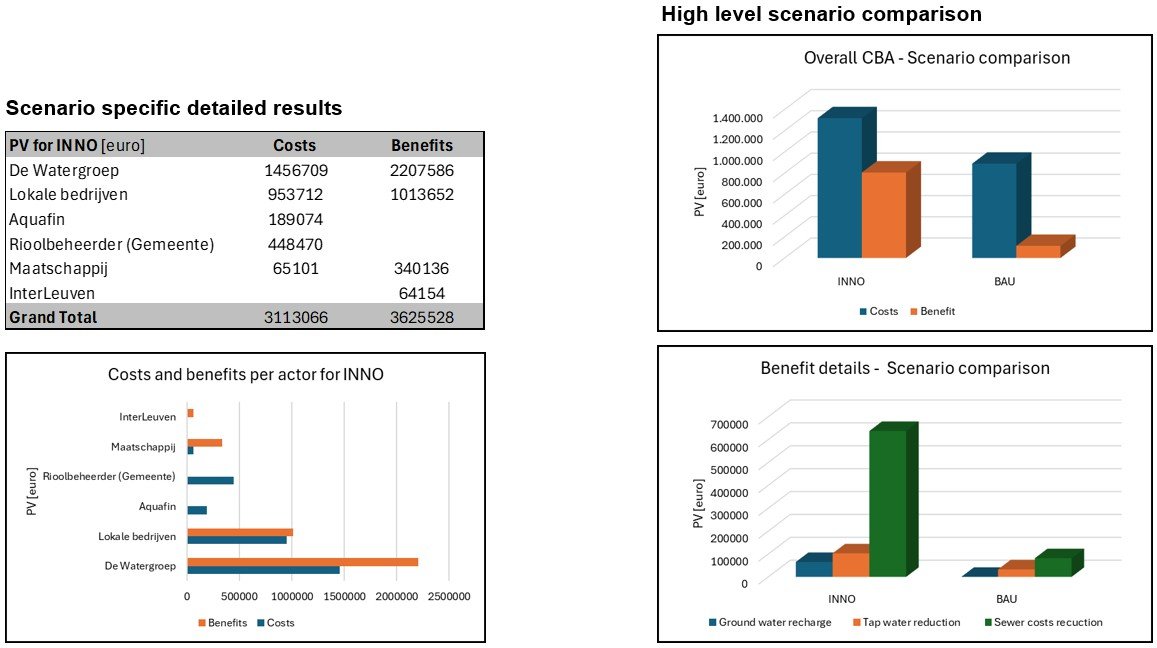
- Water Quantity Components
- Water Quality Components
- Economic Components
- 1. First scenarios : Water, energy and economic results
- 2. Second scenarios : Calibrated Results for the second scenario
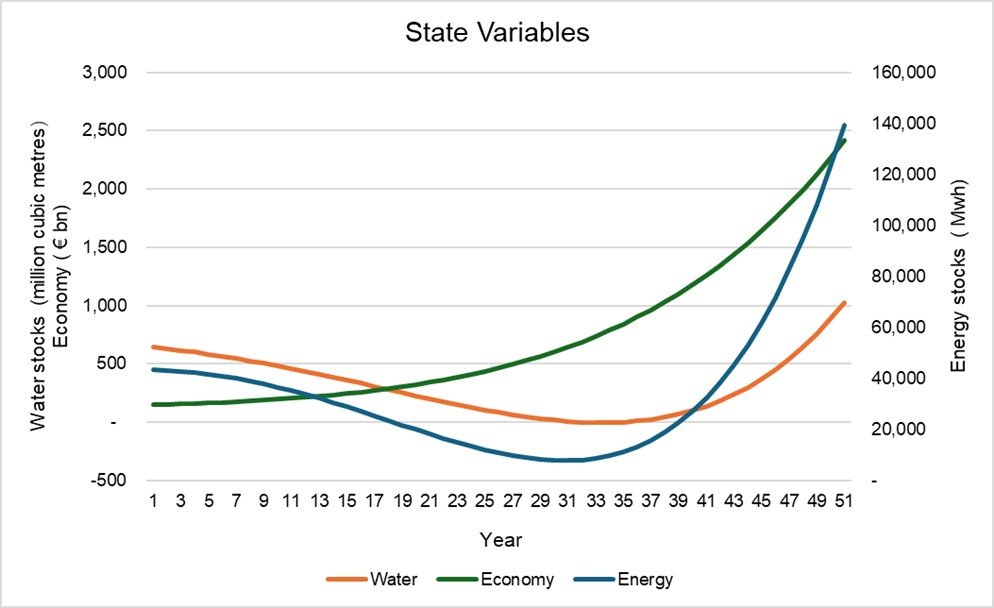
In this simulation, a time period of 50 years is considered (T = 50). The development of the three state variables for energy, water and economic capital are presented in Figure 2 below.
Calibrated Results for the first scenarios.
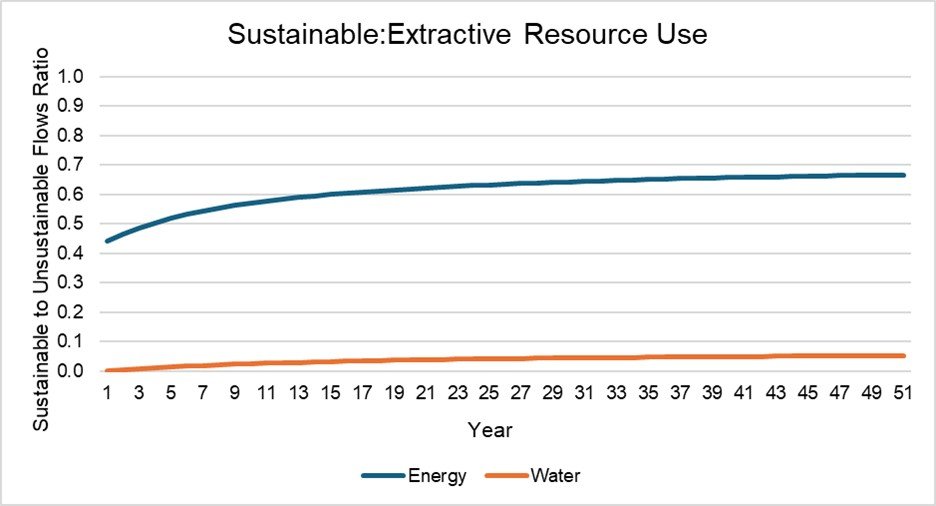
The results indicate a future scenario for Malta where economic capital and output continue to grow by 5.71% and 5.41% annually. This is a validation of the use of the production function approach utilised but can still require further elaboration possibly through the introduction of a population variable which would convert all values into per capita terms, and act as a driver for both economic output as well as demand for resources (which at the present stage is treated as an exogenous variable). It is thus the case that an implicit assumption in these results is the continued growth in population as observed in the past ten years.
Despite these positive economic outcomes, and to an extent also because of them, the stock of energy and water resources is being depleted up to the 35th year of the simulation. In the case of water, it reaches zero value. The average annual growth rate of energy and water stock is 2.36% and 0.94%, respectively. The later recovery would take place as the economy grows sufficiently to organically generate sufficient resources for the investment in the stock of these resources, and as it strives to meet the constraints for sustainable resource use in the last decade of the simulation. Despite this, the scenario is clearly unsustainable and calls for decisive action to increase investment immediately to ensure a sustainable path over the coming years, especially the more immediate ones.
Sustainability can be restored by, among others, increasing the share of output invested annually in energy and water resources. A scenario here is considered where such investment is increased by 15% in the case of energy and 30% in the case of water. The results are presented in Figure 3.
These indicate a much lower rate of depletion in the stocks of resources in earlier years and a better rate of recovery in later years. While economic capital and output do not suffer because of this as they still grow by 5.71% and 5.41% respectively, it can be expected that the level of consumption would be affected.
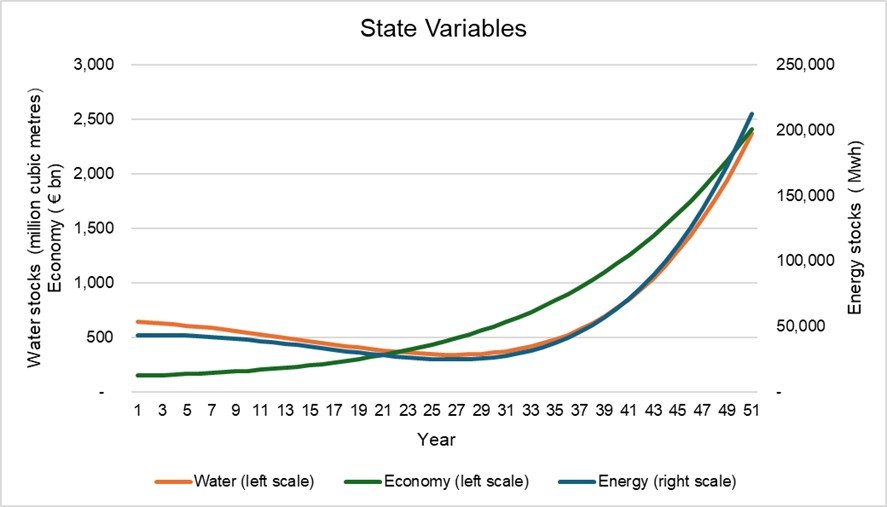
State Variables
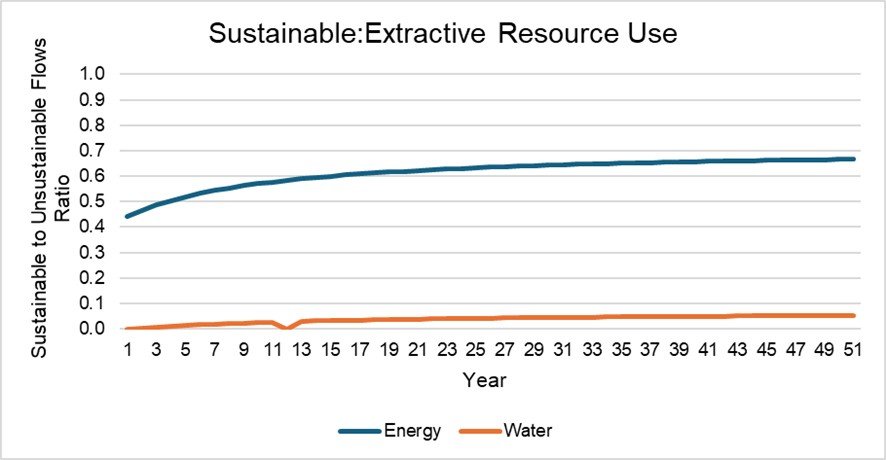
Sustainable: Extractive Resouce Use
This report details the present results of conceptual research undertaken to explore the relationships between economic variables, energy and water resources from the perspective of dynamic sustainability. It details the development of the conceptual model in algebraic form, showing the dynamic relations and constraints. It presents an application to the Maltese economy using calibrated values.
These results show that economic growth can coexist with rapid early depletion of water and energy stocks. Therefore, without increased investment, Malta risks unsustainable trajectories particularly in water within 3 decades. This implies that moderate increases in reinvestment are needed to improve sustainability while maintaining growth.
The intention is to continue enhancing the model, which currently focuses only on energy and water. To fully represent the WEFE Nexus, future development will integrate local food production by including agriculture and ecosystem components. There is also room to gather additional relevant data, refine model coefficients and expand the model’s relationships to achieve more detailed and accurate results.